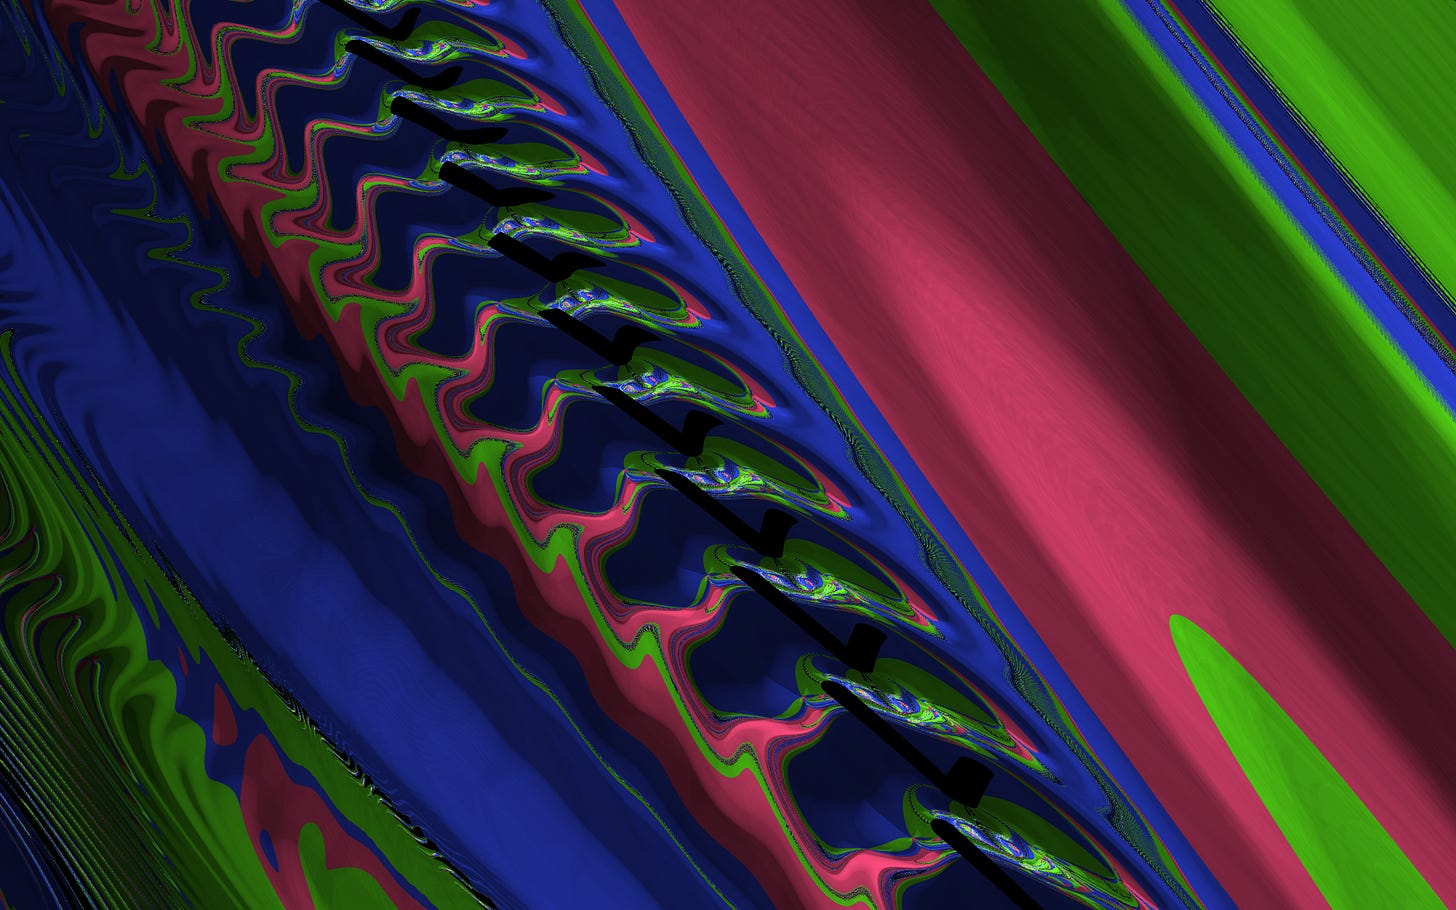
Gravitational Fractals
A chaotic era is starting!
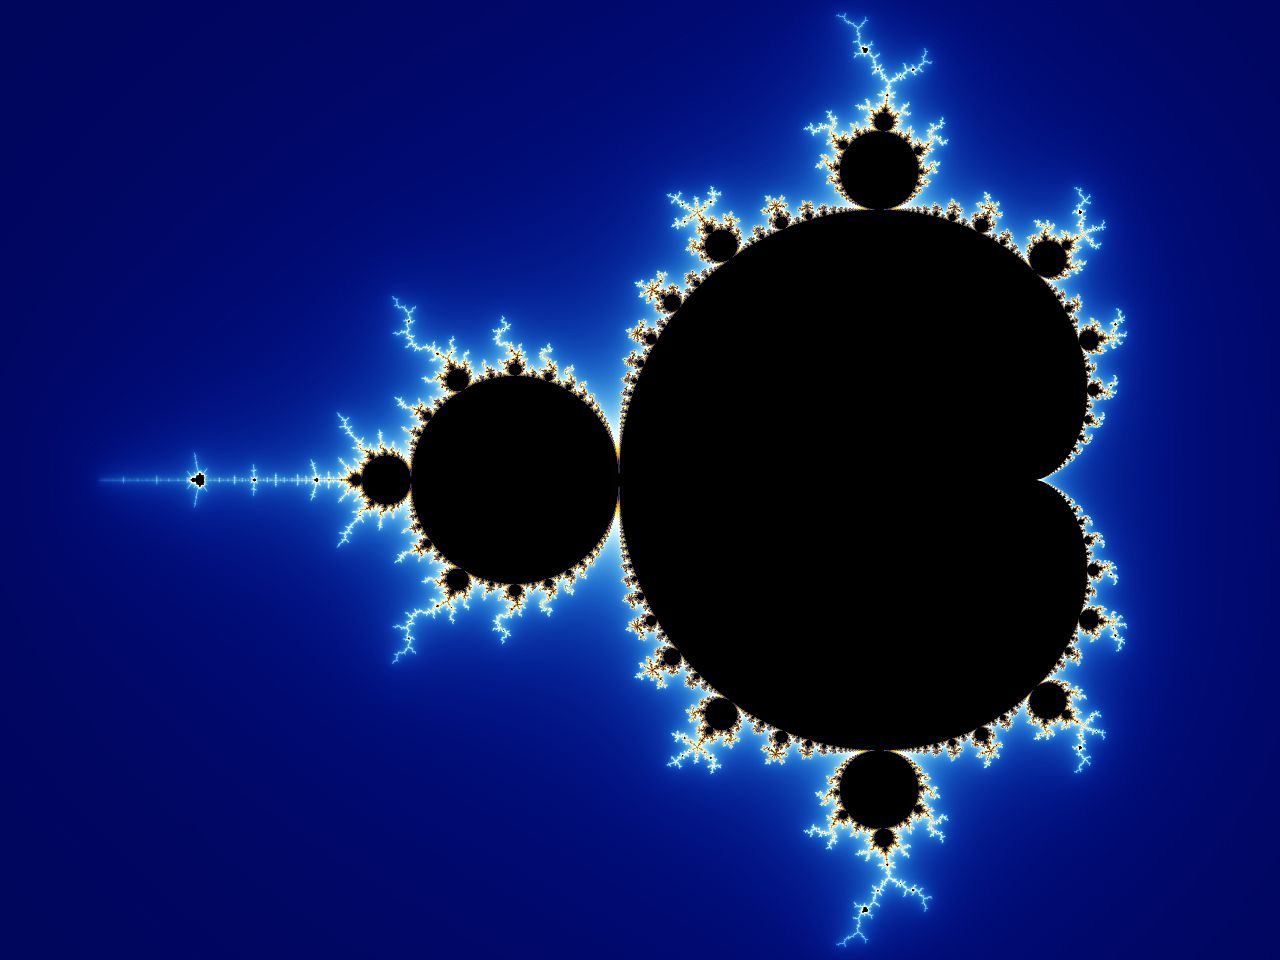
The Mandelbrot Set and its dazzling fractal structure has fascinated artists, mathematicians and computer scientists for decades.
Here’s how these images are generated.
Every pixel in the image is mapped to a position in the Complex Plane, aka a 2-dimensional vector centred around [0,0]. Calling each one of these numbers Z, we apply this formula repeatedly up to some maximum iteration number, where C remains the original position value we started at and the first Z is 0:
If we map the number of iterations it took for Z to escape a distance of 2 from the origin to a colour, we get these beautiful images. No matter how far we zoom into this image, we see more detail and a lot of it is self-similar - a fractal. Fractal explorers such as Cliff Pickover have thoroughly explored the phenomena occurring in the Mandelbrot set.
https://en.wikipedia.org/wiki/Mandelbrot_set
One way to make sense of what’s happening though, is to focus on visualising the path these numbers take. In fact, let’s think of them as “particles” that are being moved around by the mathematics of the formula. If we draw all the locations the particles arrive at during the recursion, we get these nice images called “Buddhabrots”.
Buddhabrot example on shadertoy
I like this way to think about the system as physical particles in a 2D space rather than just abstract numbers, and I’d like to revisit this in a future article, but for now let’s stay on target.
Much of the theory around fractals relates to the concept of chaos - the Mandelbrot set exhibits the hallmarks of chaos theory: extreme sensitivity to initial conditions and lack of closed form solutions to calculate the result for any given number of iterations, meaning we are required to perform iterative calculations (step by step) to get a result. Since the system is extremely sensitive to initial conditions in a chaotic way, you’d think that the ultimate output when visualised this way would be pure noise, but often where there is chaos in a dynamical system, a fractal is probably hiding under the surface, and often the region of this parameter space that is most subject to chaos also displays some kind of infinitely deep but “organised” structure. Fractals are objects that display details on all scales (i.e. no matter how much we zoom), and usually self-similarity at different scales.
I don’t want to linger on the set for too long as I’d like to get to the main bit of this article, but know that many other fractals exist, such as the Burning Ship fractal and Newton’s Fractal, and fractals have often been described for chaotic systems such as the Lorenz Attractor.
The Three-Body Problem
One of the most notorious chaotic dynamical systems is the Three-Body Problem, in which three objects in space orbit around each other under the force of gravity. Before we look at it, let’s look at the two body problem, e.g. the system that the Moon and Earth form together.
In this case we can perfectly calculate where any of the bodies will be at any point in the future given just their starting conditions. Orbits are stable ellipses, and the shape of the ellipse is very simply explained by some formulas (we’re only considering Newtonian gravity, it seems things get more complex with General Relativity).
If we add just one more body, all of this goes out the window for anything other than a number of extremely specific starting conditions. Just like in the Mandelbrot Set, a tiny change in the initial position or velocity of any of the bodies results in completely diverging trajectories through space. Sometimes a body is flung out from the system entirely. Chaos! So given this kind of chaos is present, is a fractal also present?
DRUMROLL.
Probably.
Actually, this topic has been studied in academia, but I’m surprised by the lack of nice images of the resulting fractals, with most of the focus being on the maths.
https://www2.oberlin.edu/math/Research/FractalsNbodyB.pdf
https://arxiv.org/abs/1509.07638
Actually, just before publishing this I found one interesting and very recent article on a very related topic, but the author has a PhD and writes in a much more formal style I can’t (and possibly don’t aim to) replicate - I suggest giving it a read! It’s focused more on how starting conditions close to each other diverge over time.
https://blbadger.github.io/3-body-problem.html
Ok let’s write the sim. We’re going to use a per-pixel approach similar to how the Mandelbrot set is rendered.
I start off with the bodies defined in terms of positions and velocities, figure out attraction forces between the bodies and then integrate up to a maximum number of iterations (similar to my previous article on magnetic dipoles).
To venture into the turbulent realm of chaotic dynamical systems, we need to come well prepared to fight our greatest enemy, numerical instability. In our case the battle is totally hopeless, and we are challenged from two fronts:
Numerical integration errors
When doing a discrete simulation where many forces are added in an iterative way and there is no damping from something like friction, floating point precision errors will often cause the energy to not be conserved so we will usually see the values explode off to infinity. I used Verlet integration to tackle this to a large degree.
Singularities
Without collision handling, bodies can come infinitely close together, in which case the gravitational pull between them tends to infinity (e.g. they are black holes). This is a tricky one to solve because desirable chaos lies in those close range interactions, but it’s also the range where it doesn’t matter if we use Verlet or not - integration will be dodgy. I chose to just add collision handling, so if two bodies collide, it’s over.
See similar thoughts in my previous article:
Art With Magnetic Dipole Particles
Complex behaviours can arise from simple rules, from cellular automatons to n-body systems and physarum slime mold-inspired simulations - all of these can be used to create fascinating art or simply contemplate the beauty of dynamical systems and chaos. These types of simulations make us ponder that our world perhaps also emerges from very simple rules …
None of this is surprising as we know these systems are extremely sensitive to initial conditions, and any amount of integration error will affect the results catastrophically, so we won’t always know for sure if the things we are seeing are cool gravitational dynamics or just some kind of “integration error fractal”.
We can set the starting positions of bodies A and B to be fixed (say [-1.0,0.0] and [1.0,0.0], but by setting the starting position of body C based on the pixel location on the screen, we can then run one simulation of the Three-Body Problem per pixel, up to a maximum number of iterations. Yes, each pixel is one separate entire simulation of the three bodies. If we run it in 1920x1080 that’s 2 million or so separate starting conditions and results.
Here are some options we can use to set the resulting pixel colour:
Number of iterations it took for C to escape past a certain distance from origin (like in the Mandelbrot Set).
Maximum or minimum distance C ever came to A or B, or origin.
Maximum or minimum distance any of the bodies every approached.
Maximum velocity C ever achieved.
I’m going to use “max distance any body approached” as the metric. This means that if any bodies collided, a pixel will be black. We’ll otherwise colour the pixel one of 3 colours depending on which pair of objects came closest (I also scaled the colour brightness by the minimum distance itself).
Let’s try a simple test first: just bodies A and C with no initial velocities (the two body problem). No matter where we start body C, the bodies attract each other and collide so the entire screen is black- as expected!
(I didn’t include the picture sorry)
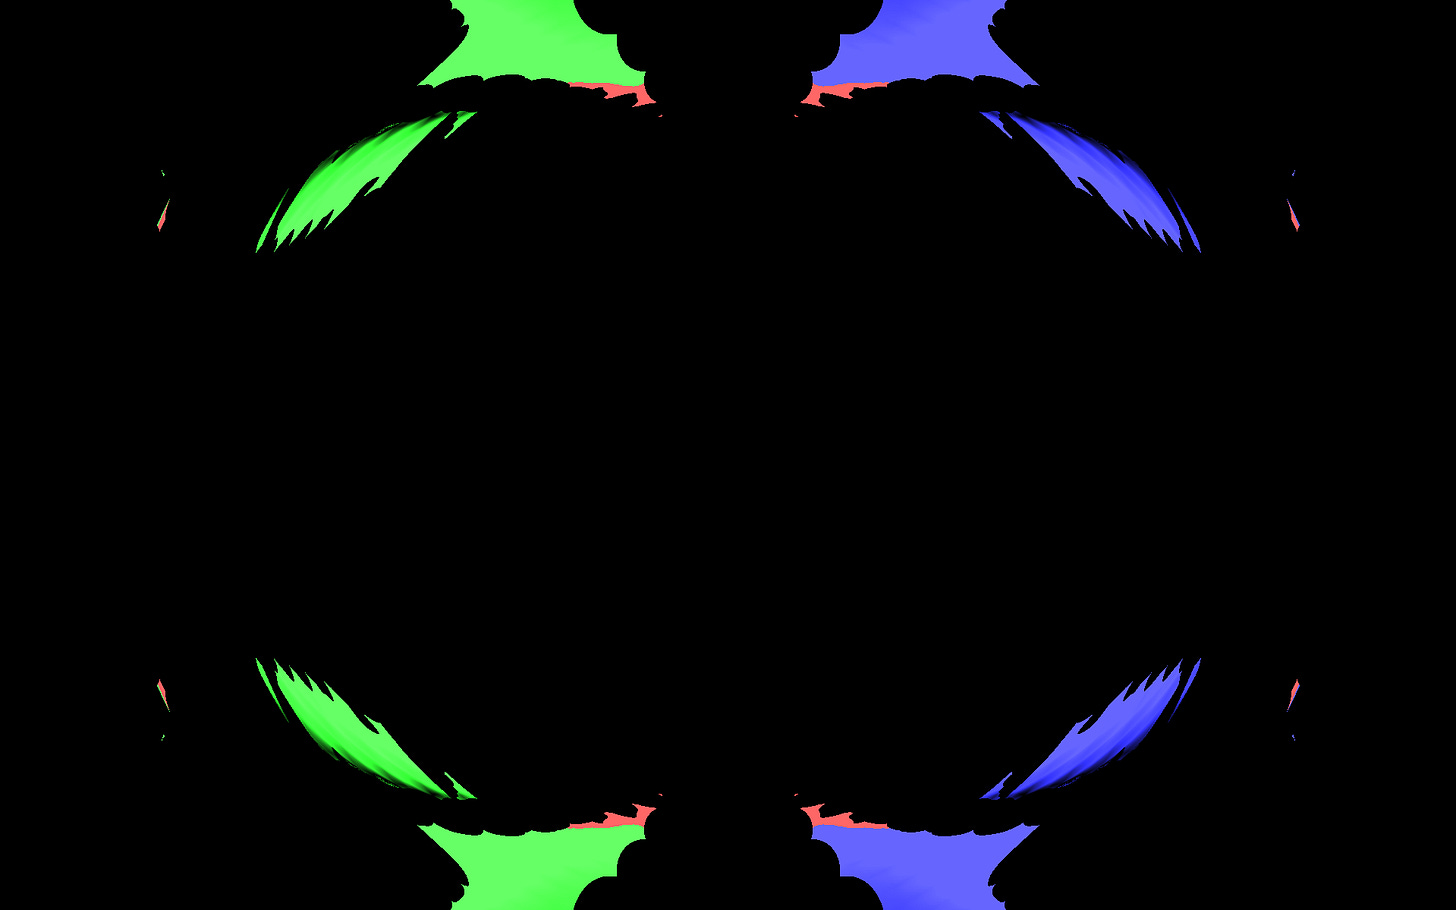
Armed with a functioning algorithm, let’s run it with three bodies and see what comes out. Bodies A and B start at positions (-1, 0) and (1,0), so just left and right of centre, about halfway to the edge of the screen, while the third body’s position is based on the pixel location. Here’s the result after 128 iterations per pixel.
Cool! Any of the black pixels are where the bodies collided. The coloured regions are where the bodies swirled past each other, the colour is the pair of bodies that came closest and the brightness is how close they came. This way of colouring things is reminiscent of the Newton Fractal by the way…
https://en.wikipedia.org/wiki/Newton_fractal
We can see that there are very few areas where bodies don’t collide. The bodies start off with no velocity, so they are completely at the mercy of their initial distance from each other. There is no hope of orbits for the pixels in the centre of the screen because the bodies quickly collide, whereas ones to the sides of the screen result in the middle bodies colliding as they’re too far away to be deflected by the third body. The colourful areas are where C was attracted to the other two in just the right way to go between them or close to the side of them, causing them to deflect enough to avoid each other.
To help visualize this a bit better, I made it so that if I click a location on the screen, it shows what happens with the bodies if C had the starting location of the mouse press, so I can see some examples of systems that collide and ones that don’t (the little moving circles in the videos further down).
It’s very hard to find examples of systems that are even close to entering a stable orbit… most of the time the bodies swirl past each other once and then fly off to infinity. It would be interesting to visualise which of these systems persisted in some kind of orbit… what if we colour the pixels based on how long any two bodies spent in close proximity? We count the number of iterations in which the min distance was within some range and then scale the colour by that value.
float stability = num_iters_spent_in_proximity/maximum_iters;
To make the effect a bit more clear, I also applied the following non-linear transformation so that we can more clearly see where stability really gets going:
stability = smoothstep(0.0,0.1, stability*stability);
This basically makes the stabler pixels far more bright than the non-stable ones. This also means we’ll get black pixels where stability was very low, even if there were no collisions.
There’s a certain hackyness to this though - the result is highly dependent on the max iterations and deltaTime of the simulation. This is because the vast majority of configurations result in the bodies flying away from each other, so the further we simulate the more of this regime we’ll encounter, so the colours get dimmer as number of iterations and deltaTime increase. We can fiddle with the values until it just looks cool - this is after all what we do with a lot of fractals, we try to find useful but sometimes hacky ways to capture their characteristics.
Now we get the same areas but they are super dim - some iterations had distances under the min range, but these were basically just before the bodies sped past each other. Not very interesting, so let’s try to make it interesting. Let’s add some starting velocities to the bodies. Let’s throw A and B in opposite vertical directions, and start C with no velocity.
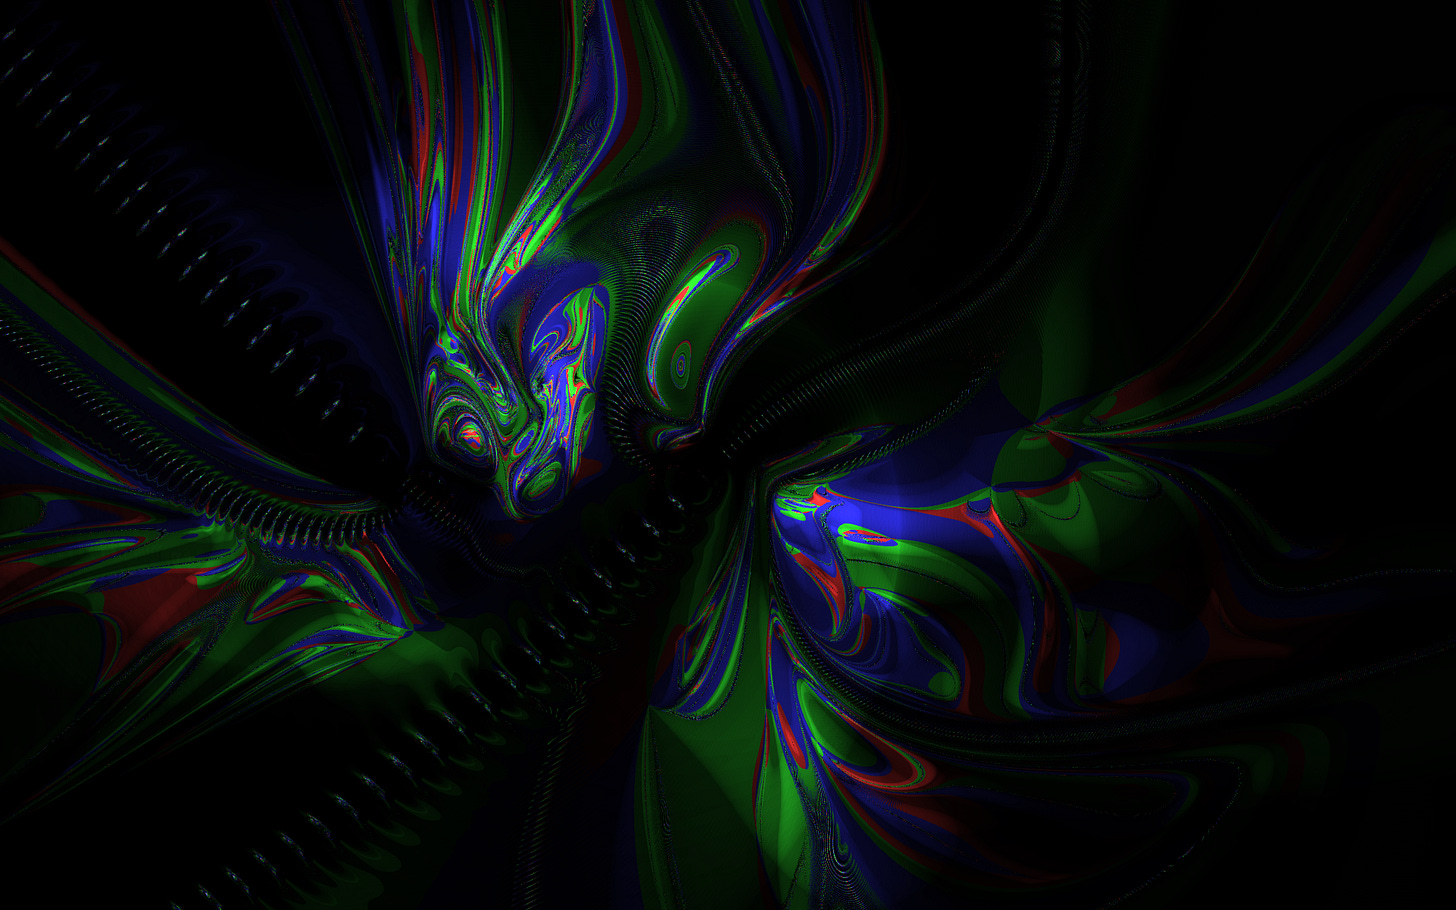
Ok now, we’re talking - we see some really swirly shapes, possible chaos, and some really bright regions. Let’s explore the bright pixels - here’s an orbit from that green bright spot bottom right of the central vortexy looking thing. We see the bodies returning to swirl past each other multiple times. In this case they never collided and also stayed fairly close together for many iterations, and even returned for a few passes.
Let’s try one in that bright “wing” on the left.
We don’t get to see it go on for that long though, so let’s up the maximum number of iterations, where we expect many more of the orbits to eventually dissipate, leaving the truly stable ones.
What’s interesting is that we’ve really filtered out the less stable ones, and the colours are a lot more consistently bright now, implying that the remaining orbits remain quite tight and possibly fairly stable. Messing around with the various parameters like the min distance threshold the contrast of the render can be adjusted a bit.
Let’s make things a bit more complex, by adding a sideways velocity to C.
Now that’s some serious swirlyness!
Here’s an interesting video where the starting velocity of C rotates slowly.
One thing I found interesting are these circular “shadows”. Looking at this parameter space visualisation, we can see how the bodies in different starting configurations block certain possible options in a very directional and possibly intuitive way. The directionality of the shadow “chains” is related to the velocity of the C object, e.g. you can see the velocities for which it would collide, and the shadows have circular shapes related to the shapes of the objects. We can see these rotate along with the velocity of C.
Now is the time to ask… is this a fractal or just some kind of cool swirly shape stuff? We don’t need to ask if it’s chaotic because we know that already and we can see the sensitive dependence to initial conditions clearly on display.
There are quantitative methods to figure out if something is a fractal or not, for example we can try to estimate its fractal dimension. I have no idea how to do that, so I’m doing a more qualitative measurement: if I zoom into it, does it have detail at all scales?
First of all, I found a lot more fractal-type detail if I decreased the size of my bodies, so they could get closer before colliding. This is a bit treacherous though because it’s hard to say if the added chaos is just numerical instability… at the scales I’m running my simulation though, I should assume I can let the bodies whiz past far closer than in these previous images. Here it is with the reduced size - we get these new chaotic chains that weren’t showing up at all before.
Let’s zoom into one of the chain links…
And it’s chains all the way down to where floats break down - heavily implying the presence of a fractal. This means that changes in the starting conditions even down to this tiny, tiny level, and down to an infinitely small scale can change whether the system results in collision or not, and which bodies will end up closer. In the 3-Body Problem, this infinity is beyond what computation can ever hope to conquer, which gives one intuitive reason for why the problem has no closed solution and an intractable numerical one.
The fact the chaos is concentrated in some special areas isn’t so surprising. There are many potentially chaotic systems for which some starting conditions are more predictable or can enter what are called limit cycles, or end up in periodic orbits with true chaos appearing here and there. We can imagine that in the case where two bodies start close but the third is extremely far away, its negligible gravitational effect makes the system much more like a two body problem. which isn’t chaotic at all.
If we bump up the maximum number of iterations, we see more regions of the space become chaotic - the more iterations we do, the more longer term orbits we capture that likely exhibit chaos. Here’s one at 1024 iterations. This started having a lot of high frequency detail everywhere so I applied some subsampling to anti-alias… my GPU hated me for this one and it doesn’t render in real-time.
Here are some more zooms.
Here’s a zoom into this lonely little chaos island off to the side.
You can try out this fractal zoom for yourself here.
https://www.shadertoy.com/view/msGGzG
It would be cool to try a variety of other obvious ways to visualise this fractal such as another metric to colour the pixels, or using the pixel location to change velocities instead of positions, but I figured this was a reasonable starting point for further experiments.
Thanks for giving this article a read, and if you liked it please subscribe to my blog where no doubt more oddities like this will follow.


